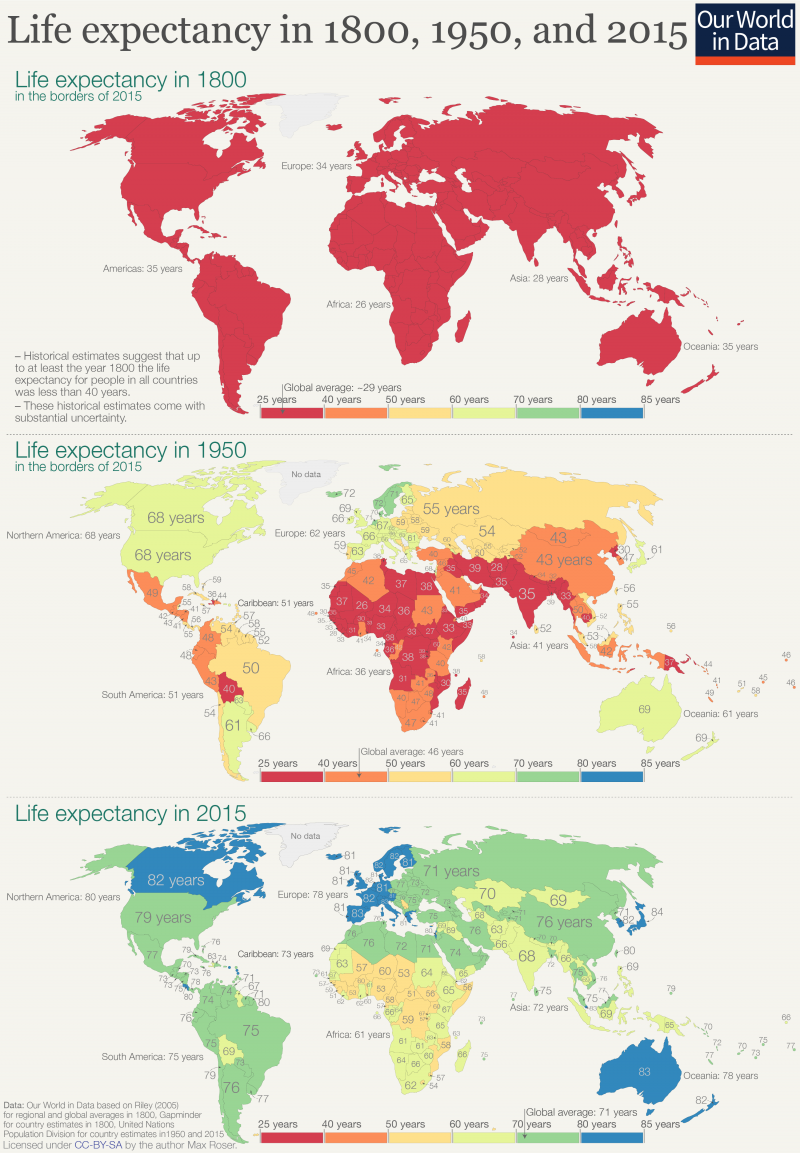
| ank | Countries and regions | Life expectancy at birth (in years) | ||
|---|---|---|---|---|
| Overall | Female | Male | ||
| 1 | 84.7 | 87.6 | 81.8 | |
| 2 | 84.5 | 87.5 | 81.1 | |
| 3 | 83.8 | 85.8 | 81.5 | |
| 4 | 83.6 | 85.5 | 81.7 | |
| 5= | 83.4 | 86.1 | 80.7 | |
| 6= | 83.4 | 85.3 | 81.1 | |
| 7 | 83.3 | 85.3 | 81.3 | |
| 8 | 82.9 | 84.4 | 81.3 | |
| 9= | 82.8 | 84.4 | 81.1 | |
| 10= | 82.8 | 85.8 | 79.7 | |
| 11 | 82.7 | 84.4 | 80.9 | |
| 12 | 82.5 | 85.4 | 79.6 | |
| 13 | 82.4 | 84.1 | 80.5 | |
| 14= | 82.3 | 84.3 | 80.3 | |
| 14= | 82.3 | 84.3 | 80.3 | |
| 16= | 82.1 | 84.5 | 79.6 | |
| 16= | 82.1 | 83.7 | 80.4 | |
| 16= | 82.1 | 84.2 | 80.0 | |
| 16= | 82.1 | 83.8 | 80.4 | |
| 16= | 82.1 | 83.9 | 80.4 | |
| 21 | 81.9 | 84.7 | 78.8 | |
| 22 | 81.8 | |||
| 23 | 81.7 | 84.6 | 78.9 | |
| 25 | 81.5 | 83.8 | 79.1 | |
| 26 | 81.4 | 83.8 | 79.0 | |
| 27 | 81.2 | 83.6 | 78.8 | |
| 28 | 81.2 | 83.9 | 78.4 | |
| 29 | 81.2 | 83.0 | 79.5 | |
| — | 81.2 | 83.8 | 78.6 | |
| 30 | 80.8 | 82.9 | 78.7 | |
| 31 | 80.8 | 82.8 | 77.8 | |
| 32 | 80.5 | |||
| 33 | 80.1 | 82.7 | 77.5 | |
| 34 | 80.0 | 82.4 | 77.6 | |
| 35 | 79.2 | 81.8 | 76.6 | |
| 36 | 79.1 | 80.4 | 77.7 | |
| 37 | 78.9 | 80.8 | 77.1 | |
| 38 | 78.9 | 81.4 | 76.3 | |
| 39 | 78.6 | 80.6 | 76.7 | |
| 40 | 78.6 | 82.4 | 73.9 | |
| 41 | 78.5 | 82.4 | 74.6 | |
| 42 | 78.3 | 81.5 | 75.1 | |
| 43 | 78.3 | 81.6 | 75.2 | |
| 44 | 78.3 | 81.0 | 75.6 | |
| 45 | 77.8 | 79.2 | 77.1 | |
| 46 | 77.8 | 81.4 | 74.0 | |
| 47 | 77.6 | 80.1 | 75.9 | |
| 48 | 77.4 | 80.8 | 73.8 | |
| 49 | 77.3 | 79.7 | 74.8 | |
| 50 | 77.2 | 78.3 | 76.3 | |
The United States is different. In nearly every other high-income country, people have both become richer over the last three decades and been able to enjoy substantially longer lifespans.
But not in the United States. Even as average incomes have risen, much of the economic gains have gone to the affluent — and life expectancy has risen only three years since 1990. There is no other developed country that has suffered such a stark slowdown in lifespans.
Why has this happened? There are multiple causes. But one big one is a lack of political power among the bulk of the population.
Government policy and economic forces have combined to make corporations and the wealthy more powerful, and most workers and their families less powerful. These workers receive a smaller share of society’s resources than they once did and often have less control over their lives. Those lives are generally shorter and more likely to be affected by pollution and chronic health problems.
Here, we show you a series of measures — about power, living standards and more — for a variety of countries. Together, they portray the disturbing new version of American exceptionalism.
We’ll start with union membership.
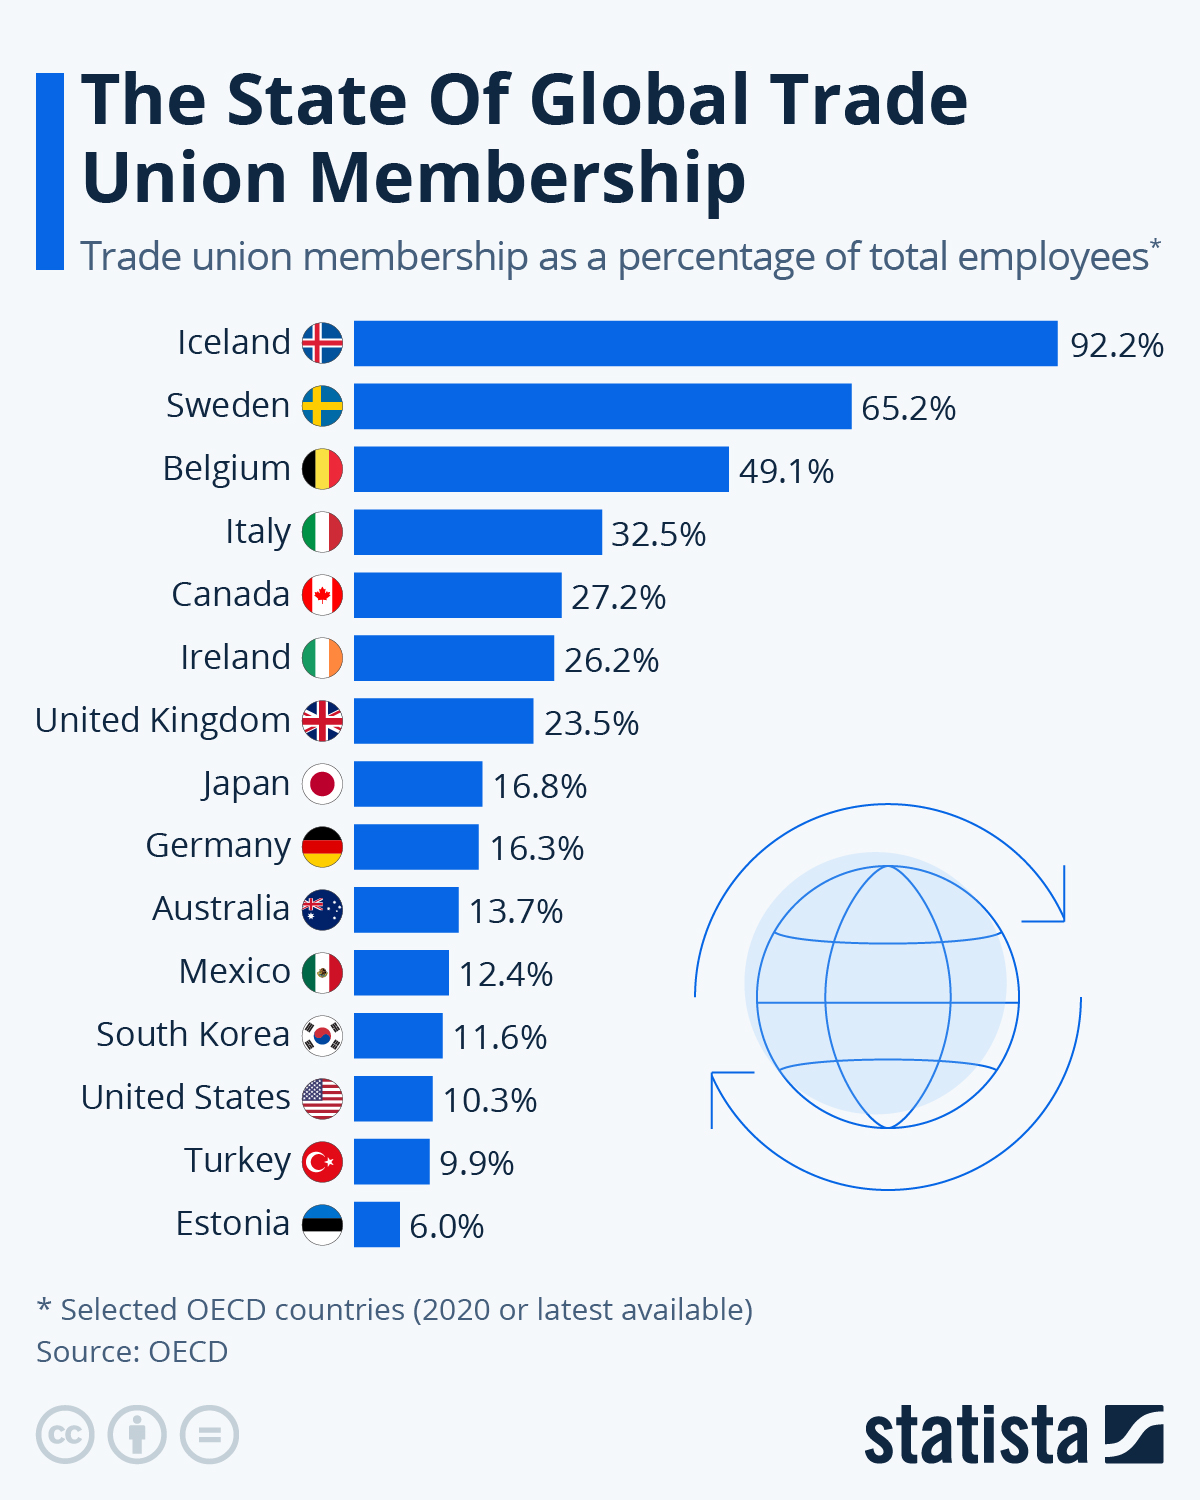
People in labor unions make substantially more money than similar nonunionized workers, academic research shows. And the share of Americans in unions has plummeted from 35 percent in the mid-1950s to about 10 percent today. The rate is even lower — about 6.2 percent — for private-sector workers.
The decline has happened largely because employers have become more aggressive about keeping out unions and government policy has made it easier for them to do so.
Unionization rates in many other countries are higher:

Union membership in 2018
The decline in unionization is one reason that the share of total national income flowing to corporate profits has risen — and the share going to worker pay has declined. The trend is starker in the U.S. than in Europe.

Higher profits have helped make the United States an outlier on executive pay, too. Although executives’ salaries have risen in most countries, relative to those of workers, in recent decades, the trend is more extreme in the U.S.
In 2005, the average CEO in the United States earned 262 times the pay of the average worker, the second-highest level of this ratio in the 40 years for which there are data. In 2005, a CEO earned more in one workday (there are 260 in a year) than an average worker earned in 52 weeks.Jun 21, 2006
Government policy plays an important role: The minimum wage is higher in other countries than it is in much of the United States. Some states have set a minimum wage higher than the federal standard, but many states in the South — home to large Black populations — have not.
Annual minimum wage in 2018
:strip_icc():format(webp)/2020-federal-state-minimum-wage-rates-2061043-final-d82d14b0792c49c8a7b85e3666d8b6b2.png)
In addition to minimum wage, the United States has done less to combat rising corporate concentration. Large U.S. companies are better able to hold down the wages of workers, who don’t always have good employment options, and are also able to charge higher prices because of less competition.
One example: American consumers pay significantly more for cellphone service than people in many other countries.
Cellphone service cost in 2019
![The Cost Of Mobile Internet Around The World [Infographic]](https://blogs-images.forbes.com/niallmccarthy/files/2019/03/20190305_Data_Cost.jpg)
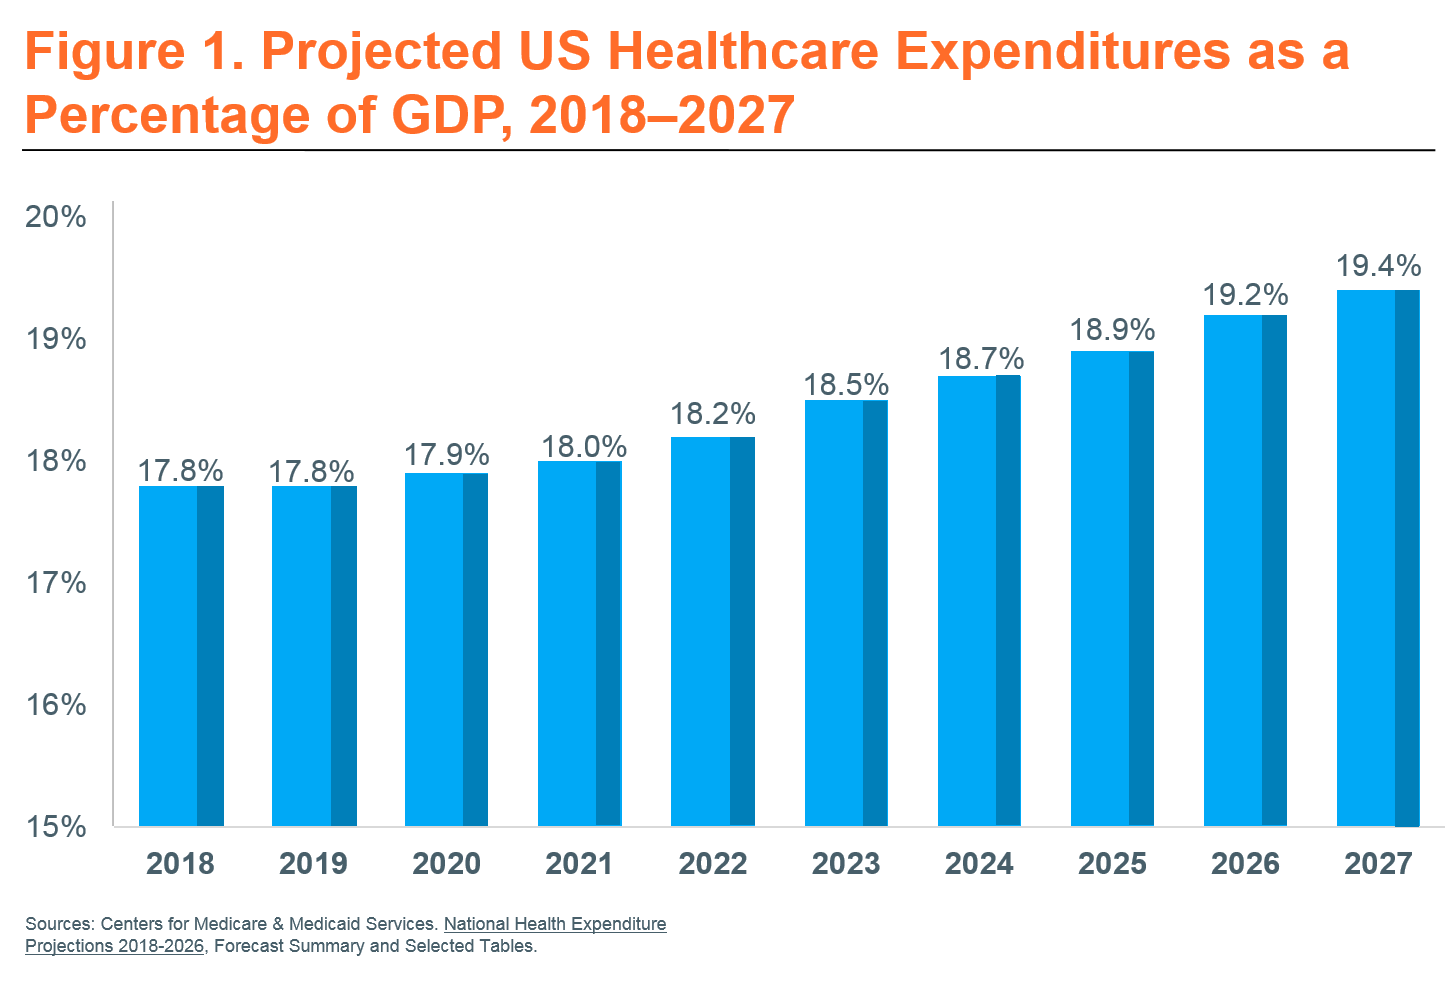
Arguably the biggest outlier is the American health care system. Prices for drugs, medical procedures and doctors’ visits are all substantially higher in the United States than in other countries. The U.S. also suffers from bureaucratic inefficiency, because of a complex health care system that spans the private sector, state governments and the federal government.

Health expenditures in 2019, share of G.D.P., projected thru 2027
In all, Americans pay almost twice as much on average for medical care as citizens of other rich countries. And as you may remember from the opening chart in this article, Americans are far from the world’s healthiest people.
Incarceration plays an important role, too. No other wealthy country puts as many people behind bars — and the prison population is disproportionately Black and Latino.
Time in prison casts a long shadow, leaving people with lingering health problems as well as permanently damaging their ability to find decent-paying work. Mass incarceration is a major reason that, even before the pandemic hit, about 30 percent of middle-aged Black men were not working in a typical week. Many of them do not count as unemployed because they are incarcerated or because they have stopped looking for work.
And a final example of how government policy exacerbates the unique inequality in the United States: tax policy.
In some other countries, like France, high-income households still pay more than half of their income in taxes on average. In the U.S., tax rates on the affluent are lower — and have fallen sharply in recent decades.

These trends have combined to increase economic inequality. The middle class and poor receive a smaller share of national income in the U.S. than in much of Europe, while the rich receive a greater share:
Share of national income
If anything, these statistics understate American exceptionalism on inequality, because Americans also work longer hours for their pay than workers in many other places:
Annual hours worked in 2018

The most common way to think about inequality is as an economic story. And it is that. But it is also a story about political power, quality of life and even the amount of time that members of different classes can expect to live.
